|
| Our subscribers' grade-level estimate for this page: 3rd - 4th |
| Research Reports Cloze Activities |
EnchantedLearning.com Graphic Organizers |
Essay Topics Writing Activities |
 Graphic organizers (some of which are also called concept maps, entity relationship charts, and mind maps) are a pictorial way of constructing knowledge and organizing information. They help the student convert and compress a lot of seemingly disjointed information into a structured, simple-to-read, graphic display. The resulting visual display conveys complex information in a simple-to-understand manner.
Increasing Understanding by Creating Graphic Organizers:
 The process of converting a mass of data/information/ideas into a graphic map gives the student an increased understanding and insight into the topic at hand. To create the map, the student must concentrate on the relationships between the items and examine the meanings attached to each of them. While creating a map, the student must also prioritize the information, determining which parts of the material are the most important and should be focused upon, and where each item should be placed in the map.
 The creation of graphic organizers also helps the student generate ideas as they develop and note their thoughts visually. The possibilities associated with a topic become clearer as the student's ideas are classified visually.
Uses of Graphic Organizers:
Graphic organizers can be used to structure writing projects, to help in problem solving, decision making, studying, planning research and brainstorming.
 Creating Graphic Organizers:
Graphic organizers can be drawn free-hand or printed. To go to printouts of many graphic organizers, click on one of the links above or below.
Adding color-coding and/or pictures to a graphic organizer further increases the utility and readability of the visual display.
How to Choose a Graphic Organizer for Your Topic/Task (click on a graphic organizer below to go to printable worksheets):
The task at hand determines the type of graphic organizer that is appropriate. The following is a list of common graphic organizers - choose the format that best fits your topic.
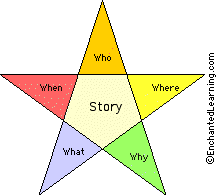
![]() Star: If the topic involves investigating attributes associated with a single topic, use a star diagram as your graphic organizer. Example: Finding methods that help your study skills (like taking notes, reading, doing homework, memorizing, etc.).
Star: If the topic involves investigating attributes associated with a single topic, use a star diagram as your graphic organizer. Example: Finding methods that help your study skills (like taking notes, reading, doing homework, memorizing, etc.).
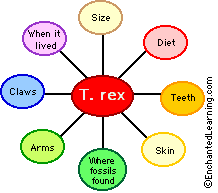
![]() Spider: If the topic involves investigating attributes associated with a single topic, and then obtaining more details on each of these ideas, use a spider diagram as your graphic organizer. This is like the star graphic organizer with one more level of detail. Example: Finding methods that help your study skills (like taking notes, reading, memorizing, etc.), and investigating the factors involved in performing each of the methods.
Spider: If the topic involves investigating attributes associated with a single topic, and then obtaining more details on each of these ideas, use a spider diagram as your graphic organizer. This is like the star graphic organizer with one more level of detail. Example: Finding methods that help your study skills (like taking notes, reading, memorizing, etc.), and investigating the factors involved in performing each of the methods.
![]() Fishbone: If the topic involves investigating multiple cause-and-effect factors associated with a complex topic and how they inter-relate, use a fishbone diagram as your graphic organizer. Example: Examining the effects of improved farming methods.
Fishbone: If the topic involves investigating multiple cause-and-effect factors associated with a complex topic and how they inter-relate, use a fishbone diagram as your graphic organizer. Example: Examining the effects of improved farming methods.
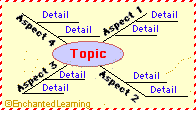
![]() Cloud/Cluster: If the topic involves generating a web of ideas based on a stimulus topic, use a clustering diagram as your graphic organizer. Example: brainstorming.
Cloud/Cluster: If the topic involves generating a web of ideas based on a stimulus topic, use a clustering diagram as your graphic organizer. Example: brainstorming.
![]() Tree: If the topic involves a chain of events with a beginning and with multiple outcomes at each node (like a family tree), use a tree as your graphic organizer. Example: Displaying the probabilistic results of tossing coins.
Tree: If the topic involves a chain of events with a beginning and with multiple outcomes at each node (like a family tree), use a tree as your graphic organizer. Example: Displaying the probabilistic results of tossing coins.
![]() Chain of Events: If the topic involves a linear chain of events, with a definite beginning, middle, and end, use a chain of events graphic organizer. Example: Analyzing the plot of a story.
Chain of Events: If the topic involves a linear chain of events, with a definite beginning, middle, and end, use a chain of events graphic organizer. Example: Analyzing the plot of a story.
![]() Continuum/Timeline: If the topic has definite beginning and ending points, and a number of divisions or sequences in between, use a continuum/timeline. Example: Displaying milestones in a person's life.
Continuum/Timeline: If the topic has definite beginning and ending points, and a number of divisions or sequences in between, use a continuum/timeline. Example: Displaying milestones in a person's life.
![]() Clock: If the topic involves a clock-like cycle, use a clock graphic organizer. Example topic: Recording the events in a typical school day or making a story clock to summarize a story.
Clock: If the topic involves a clock-like cycle, use a clock graphic organizer. Example topic: Recording the events in a typical school day or making a story clock to summarize a story.
![]() Cycle of Events: If the topic involves a recurring cycle of events, with no beginning and no end, use a cyclic graphic organizer. Example topic: Documenting the stages in the lifecycle of an animal.
Cycle of Events: If the topic involves a recurring cycle of events, with no beginning and no end, use a cyclic graphic organizer. Example topic: Documenting the stages in the lifecycle of an animal.
![]() Flowchart: If the topic involves a chain of instructions to follow, with a beginning and multiple possible outcomes at some node, with rules at some nodes, use a flowchart. Example: Computer programmers sometimes use flowcharts to organize the algorithm before writing a program.
Flowchart: If the topic involves a chain of instructions to follow, with a beginning and multiple possible outcomes at some node, with rules at some nodes, use a flowchart. Example: Computer programmers sometimes use flowcharts to organize the algorithm before writing a program.
![]() Venn Diagram: If the task involves examining the similarities and differences between two or three items, use a Venn diagram. Example: Examining the similarities and differences between fish and whales, or comparing a book and the accompanying movie.
Venn Diagram: If the task involves examining the similarities and differences between two or three items, use a Venn diagram. Example: Examining the similarities and differences between fish and whales, or comparing a book and the accompanying movie.
![]() Chart/Matrix Diagram: If the task involves condensing and organizing data about traits of many items, use a chart/matrix. Example: Creating a display of key inventions, who invented them, when, where and why they were invented, etc.
Chart/Matrix Diagram: If the task involves condensing and organizing data about traits of many items, use a chart/matrix. Example: Creating a display of key inventions, who invented them, when, where and why they were invented, etc.
![]() Y-Chart Diagram: If the task involves analyzing and organizing with respect to three qualities, use a Y-Chart. Example: Fill out a Y-Chart to describe what you know about an animal, including what it looks like, what it sounds like, and what it feels like. Or describe a character in a book, including what the character looks like, sounds like, and how the character feels.
Y-Chart Diagram: If the task involves analyzing and organizing with respect to three qualities, use a Y-Chart. Example: Fill out a Y-Chart to describe what you know about an animal, including what it looks like, what it sounds like, and what it feels like. Or describe a character in a book, including what the character looks like, sounds like, and how the character feels.
![]() T-Chart Diagram: If the task involves analyzing or comparing with two aspects of the topic, use a T-Chart. Example: Fill out a T-Chart to evaluate the pros and cons associated with a decision.
T-Chart Diagram: If the task involves analyzing or comparing with two aspects of the topic, use a T-Chart. Example: Fill out a T-Chart to evaluate the pros and cons associated with a decision.
| Flowchart of How to Choose a Graphic Organizer To find an appropriate graphic organizer, answer the following questions about your topic: 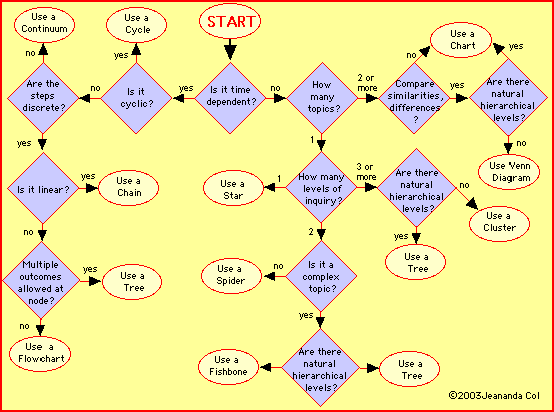 |
Enchanted Learning®
Over 35,000 Web Pages
Sample Pages for Prospective Subscribers, or click below
|
Overview of Site What's New Enchanted Learning Home Monthly Activity Calendar Books to Print Site Index K-3 Crafts K-3 Themes Little Explorers Picture dictionary PreK/K Activities Rebus Rhymes Stories Writing Cloze Activities Essay Topics Newspaper Writing Activities Parts of Speech Fiction The Test of Time
|
Biology Animal Printouts Biology Label Printouts Biomes Birds Butterflies Dinosaurs Food Chain Human Anatomy Mammals Plants Rainforests Sharks Whales Physical Sciences: K-12 Astronomy The Earth Geology Hurricanes Landforms Oceans Tsunami Volcano |
Languages Dutch French German Italian Japanese (Romaji) Portuguese Spanish Swedish Geography/History Explorers Flags Geography Inventors US History Other Topics Art and Artists Calendars College Finder Crafts Graphic Organizers Label Me! Printouts Math Music Word Wheels |
Click to read our Privacy Policy
| Search the Enchanted Learning website for: |